Disaster Preparedness for Property Management: Professional Emergency Response Framework
Professional emergency response frameworks for property management deliver through three proven mechanisms: proactive risk frameworks that identify vulnerabilities before incidents strike, scalable response protocols that work across your entire portfolio, and compliance documentation that reduces liability exposure significantly. This guide provides the exact systems needed to optimize insurance premiums, improve resident retention during crises, and ensure compliance across all jurisdictions while turning preparedness investments into measurable returns.
Key Takeaways
- Proven ROI: Natural hazard mitigation saves $6 on average for every $1 spent on federal mitigation grants¹, with some studies showing returns up to $13 per dollar invested².
- Property-specific risk assessment frameworks identify vulnerabilities across natural hazards, infrastructure, demographics, and business impact.
- Scalable incident command structures: enable coordinated response from single-property incidents to portfolio-wide disasters.
- Multi-channel resident communication systems: ensure critical information reaches all stakeholders during emergencies.
- Strategic supply distribution models: balance immediate access with economic efficiency.
- Continuous improvement programs with measurable KPIs demonstrate preparedness value to stakeholders.
- 30-60-90 day implementation roadmap provides actionable steps for immediate program launch.
The Business Case for Professional Disaster Preparedness
The conference room falls silent when you mention disaster preparedness—until you show the CFO that according to FEMA’s Natural Hazard Mitigation Saves study, natural hazard mitigation saves $6 on average for every $1 spent on federal mitigation grants¹. This isn’t theoretical. It’s documented across thousands of properties nationwide implementing comprehensive emergency management systems.
Quantifiable risk reduction starts with understanding that significant disaster damage consists of preventable secondary damage. Consider frozen pipes: unprepared properties sustain major losses, while properties with winterization protocols and rapid response minimize damage. The U.S. has experienced $746.7 billion in disaster losses over the past five years (2020-2024), with annual costs averaging $149.3 billion³. Across ten properties, systematic preparedness prevents hundreds of thousands in annual losses from single hazards alone
Liability protection extends far beyond insurance coverage. Properties with documented preparedness programs benefit from streamlined claims processing and improved settlements. Comprehensive documentation provides your legal team with affirmative defense against substantial negligence claims in multi-family settings. The preparedness manual gathering dust on your shelf has no legal value—the digital, auditable, regularly-tested system does.
Competitive differentiation now drives leasing decisions. Post-pandemic research reveals emergency preparedness ranks highly in resident decision factors. Well-prepared properties can command premium rents. Corporate tenants increasingly require preparedness certifications in commercial RFPs. The market has spoken: preparedness is now a profit center.
Insurance premium considerations flow directly to your bottom line. According to the U.S. Chamber of Commerce, every $1 invested in natural disaster resilience and preparedness can realize $13 in long-term economic savings². The real value lies in expanded coverage limits and reduced deductibles—often substantially lower per incident. One avoided claim pays for a decade of preparedness programs.
Operational continuity compounds returns over time. Prepared properties experience significantly less disaster downtime, preserving substantial annual revenue per property. Staff retention improves when employees trust your emergency protocols. Residents renew leases more often after experiencing professional crisis management.
These benefits materialize through systematic implementation, not wishful thinking.
Building Your Property-Specific Risk Assessment Framework
Multi-Property Risk Mapping and Prioritization
Risk assessment isn’t about imagining disasters—it’s about mapping vulnerabilities with the precision of an insurance actuary. Every property in your portfolio faces four risk dimensions: natural hazard exposure, infrastructure vulnerability, resident demographics, and business impact potential.
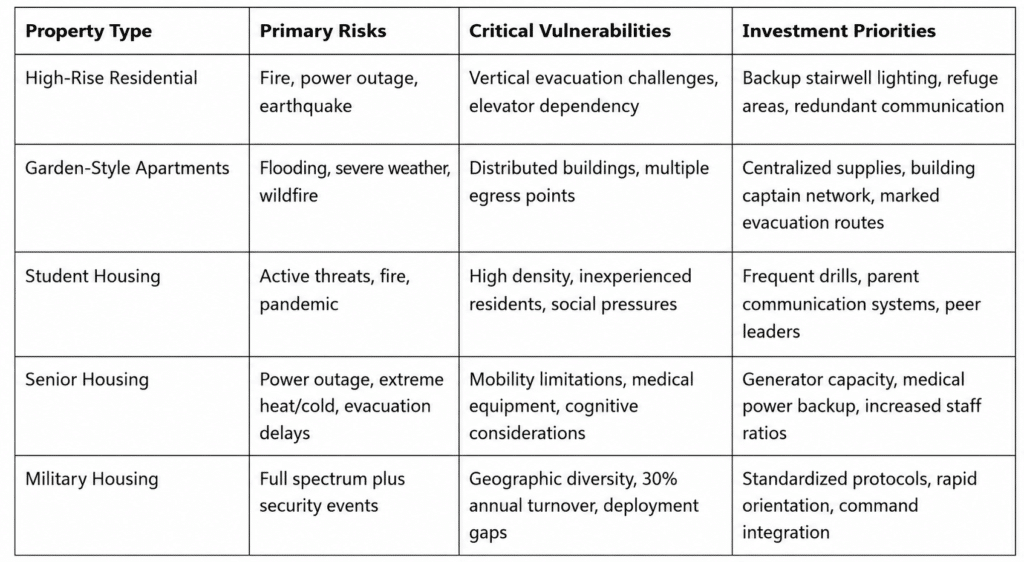
Geographic analysis extends beyond checking FEMA flood maps. Properties within two miles of industrial facilities need chemical shelter-in-place capabilities. Coastal properties require hurricane response starting 72 hours before landfall through two weeks post-impact. Wildfire zones demand air quality monitoring and graduated evacuation triggers.
Standard assessments miss a critical reality: properties experience three times more utility-related emergencies than natural disasters. Yet most preparedness budgets chase dramatic scenarios while ignoring the mundane failures that hurt residents and budgets. Smart portfolios allocate resources based on probability-weighted impact, not Hollywood scenarios.
Regulatory Compliance Matrix Development
Compliance isn’t optional, and ignorance isn’t defense. Federal, state, and local requirements create overlapping obligations that vary by property type, location, and resident demographics.
Fair Housing Act provisions mandate more than wheelchair ramps. Emergency communications must reach residents with vision, hearing, and cognitive disabilities. This means visual fire alarms, multiple notification formats, and accessible evacuation routes that work when elevators fail. One overlooked accommodation becomes a substantial lawsuit risk.
State requirements often exceed federal minimums significantly. Different states have varying requirements for emergency preparedness in multi-family housing. Missing these requirements doesn’t just risk fines—it can void insurance coverage.
Documentation protects you only when it’s complete, current, and accessible. Digital systems with version control and audit trails prove compliance while paper binders prove nothing. Cloud storage with local redundancy ensures access during outages while maintaining legal chain-of-custody. Your documentation system is your defense attorney’s best friend or worst nightmare.
Stakeholder Impact Analysis
Disasters don’t affect isolated individuals—they impact entire ecosystems. Mapping stakeholder needs before crisis strikes transforms chaos into coordination.
Residents need life safety first, then information, then property security. Staff need clear roles, decision authority, and assurance their families are safe. Vendors need access protocols and payment guarantees. Insurance carriers need immediate notification and preserved documentation. Municipal services need established relationships and tested communication channels.
This web of relationships requires quarterly contact updates and annual tabletop exercises. The fire chief you meet during an emergency is a stranger. The one you meet quarterly is a partner.
Developing Scalable Emergency Response Protocols
Incident Command Structure for Property Management
Traditional incident command assumes single-site disasters with clear hierarchies. Property management reality involves multiple sites, after-hours incidents, and business continuity demands. Your structure must scale from a single water leak to portfolio-wide hurricanes.
Property-level response teams need three-deep succession for every critical role. The senior manager leads, maintenance supervises operations, and leasing manages communications. Thursday’s gas leak happens Saturday night when the manager’s in Cabo, maintenance is at his daughter’s recital, and leasing is a new hire. Three-deep succession means someone qualified always answers.
Regional coordination hubs activate when single properties can’t cope or multiple sites need support. Regional managers maintain go-bags with portable power, redundant communications, and digital access to every property’s plans. Activation happens within 30 minutes, full operation within two hours. This isn’t a conference call—it’s a command center.
Communication hierarchies must function when normal business structures fail. After-hours protocols can’t depend on one manager’s phone. Automated escalation ensures someone always responds. Mass notification reaches personal devices while maintaining FCC compliance. The 2 AM water main break reaches decision-makers, not voicemail.
Decision authorities expand during emergencies through pre-documented thresholds. Property managers authorize immediate emergency expenditures. Regional managers approve larger amounts. These aren’t suggestions—they’re board-approved, vendor-communicated, exercise-tested authorities that eliminate paralysis when seconds matter.
Technology-Enabled Response Systems
Paper checklists and phone trees died with flip phones. Modern incident management platforms coordinate response through real-time dashboards accessible from any device, anywhere, even offline.
Essential platform capabilities include mass notification across multiple channels, task management with accountability tracking, resource coordination across properties, and automatic documentation for legal protection. Costs run moderately per unit monthly—less than one insurance deductible reduction pays for a decade of service.
Learn more about incident management reporting systems
Remote monitoring transcends traditional security cameras. Water sensors prevent substantial leak damage through rapid response versus next-day discovery. Environmental monitors trigger HVAC adjustments during wildfire smoke events. Structural sensors detect settlement before cracks become lawsuits.
Standardized Response Procedures by Incident Type
Generic emergency procedures kill people and portfolios. Your procedures must be specific enough to guide panicked decision-making yet flexible enough for property variations.
Natural disasters demand phase-based responses. Hurricane preparation begins 96 hours out with resident notifications and property hardening. T-minus 48 hours triggers supply distribution and evacuation decisions. T-minus 24 hours means final preparations and shelter operations. Post-impact shifts to damage assessment, life safety, and recovery coordination. Each phase has specific triggers, actions, and documentation requirements.
Facility emergencies require immediate technical response. Fire means simultaneous evacuation, system isolation, and fire department support—not sequential actions. Major leaks need instant shut-off, resident relocation within 30 minutes, and restoration vendor mobilization within an hour. Power outages trigger life safety verification first, then generator deployment, then resident support.
Security incidents balance immediate safety with investigation preservation. Active threats follow Run-Hide-Fight adapted for your specific layouts. Civil unrest requires perimeter security without creating prison atmospheres. Every response preserves evidence while protecting people.
Resident Communication and Engagement Systems
Pre-Incident Education Programs
Prepared residents experience fewer injuries and cause less secondary damage. Traditional preparedness education fails because it’s boring, generic, and forgotten before it’s needed.
Effective education starts at move-in. Digital welcome packets deliver property-specific emergency guides, personal evacuation routes, and customized supply checklists. QR codes by elevators and mailboxes link to mobile-friendly resources, achieving dramatically higher engagement versus printed materials.
Multi-language needs exceed Google Translate. Professional translation for languages representing 5% or more of residents ensures comprehension during stress. Pictographic signs and universal color-coding transcend language entirely. The red arrow means “exit” in every language.
Emergency Communication Protocols
When disaster strikes, residents need information more than anything except immediate safety. Multi-channel delivery ensures messages penetrate the chaos.
Primary SMS alerts achieve rapid delivery. Secondary emails provide details for non-urgent updates. Mobile apps enable two-way communication—residents report their status while you push updates. Audible alarms with voice messaging break through when phones are silenced or networks fail.
Templates eliminate dangerous delays. Pre-written messages with variable fields ensure completeness while enabling rapid deployment. Pre-translated versions eliminate the scramble for interpreters when seconds count. The hurricane warning goes out in English, Spanish, and Mandarin simultaneously, not sequentially.
Community Building for Resilience
Individual preparedness fails. Community preparedness succeeds. Building resident networks before disasters creates resilience that no amount of supplies can match.
Floor captain programs distribute leadership throughout properties. Captains receive enhanced training, emergency supplies, and direct communication with management. Monthly meetings maintain engagement without exhaustion. Quarterly drills prove effectiveness. Captain-led buildings show measurably improved evacuation times and accountability.
Special needs registries identify vulnerable residents without violating privacy. Voluntary registration captures mobility limitations, medical equipment needs, and communication requirements. Buddy systems pair vulnerable residents with capable neighbors, creating redundant support that saves lives when staff are overwhelmed.
Supply Management and Resource Allocation
Centralized vs. Distributed Supply Strategies
The supply closet locked in the basement during flooding helps nobody. Strategic distribution balances immediate access with economic efficiency.
Distributed supplies at each property enable rapid response. Centralized warehouses offer bulk purchasing and simplified rotation. Hybrid models place critical supplies at properties while maintaining regional reserves for extended incidents. A water leak needs immediate supplies. A hurricane needs sustained support.
Calculating requirements starts with occupancy-based formulas: water at one gallon per person per day⁴, food at 2,000 calories daily, basic medical for minor injuries. Support 10% of residents for 72 hours minimum. High-risk properties increase by 50%. These aren’t arbitrary numbers—they’re validated through decades of disaster response.
Budget frameworks tie investments to risk assessments. Supply costs vary by region and vendor relationships. Bulk purchasing through management associations reduces costs substantially. One prevented water damage claim funds supplies for hundreds of units.
Critical Systems and Infrastructure Redundancy
Backup power scales from portable generators for life safety to fixed installations supporting full operations. Calculate loads prioritizing elevators for evacuation, emergency lighting for egress, and minimal HVAC for extreme weather. Fuel management ensures 72-hour runtime with tested refueling contracts.
Water redundancy addresses both interruption and contamination. Store three gallons per person per day—one for drinking, two for sanitation. Purification tablets, filters, or UV systems provide contingency for extended outages or contamination events. The pool becomes emergency storage with proper treatment.
Vendor and Contractor Preparedness
Pre-qualified vendor networks prevent price gouging while ensuring response. Master service agreements establish scope, pricing, and response times before disasters create leverage. Priority service contracts guarantee response when demand spikes. Retainer agreements secure specialized services that disappear during widespread events.
Training, Testing, and Continuous Improvement
Staff Training Programs and Certification
Generic training creates dangerous false confidence. Role-specific preparation ensures competence when stress peaks and time evaporates.
Maintenance staff need substantial annual training on utility isolation, generator operations, and damage assessment—hands-on training, not videos. Managers require focused training on incident command, documentation, and resident relations—scenario-based, not theoretical. All staff get essential training on evacuation, communication, and personal safety—practiced, not preached.
Professional certifications enhance capability and credibility. The Certified Emergency Manager credential demonstrates comprehensive expertise. FEMA’s Professional Development Series provides free, applicable training. Insurance companies notice—and may offer discounts for—certified preparedness.
Drill Programs and Emergency Simulations
Quarterly evacuation drills maintain muscle memory without creating fatigue. Annual full-scale exercises test comprehensive response. Unannounced drills validate readiness but require careful stakeholder management—surprise your staff, not your residents into vacancy.
Explore remote incident management capabilities
Tabletop exercises deliver maximum value with minimum disruption. Progressive scenarios from simple to complex build confidence while revealing gaps. After-action reviews identify improvements without blame—psychological safety enables honest assessment and real improvement.
Measuring Preparedness ROI and Performance Metrics
Key Performance Indicators for Preparedness
What gets measured gets managed. What gets managed gets funded. Preparedness metrics prove value while driving improvement.
Response metrics track notification-to-mobilization, response-to-stabilization, and incident-to-recovery intervals. Participation metrics measure drill attendance, training completion, and exercise engagement. Compliance metrics monitor plan updates, inspection completion, and documentation currency.
Executive dashboards consolidate strategic metrics while providing operational detail for improvement. Leading indicators predict readiness. Lagging indicators measure performance. Balanced scorecards weight prevention, preparation, response, and recovery equally—because excellence requires all four.
Financial Impact Tracking
Prevented losses require baseline establishment and consistent methodology. Compare against peer properties or historical incidents. Track avoided damage, reduced downtime, prevented liability, and preserved reputation.
ROI calculations encompass direct savings and indirect benefits. According to the National Institute of Building Sciences, federal mitigation grants save $6 for every $1 spent⁵. Direct returns include premium reductions, prevented losses, and optimized resources. Indirect value includes improved retention, enhanced reputation, and increased property values. Document everything—CFOs appreciate proven returns.
Continuous Improvement Framework
Static preparedness is declining preparedness. Continuous improvement integrates lessons from incidents, exercises, and industry evolution.
Quarterly reviews assess recent performance and emerging threats. Annual strategic reviews evaluate program effectiveness and resource allocation. Continuous monitoring of regulations and best practices ensures currency. The preparedness program that worked last year might fail tomorrow.
Implementation Roadmap and Next Steps
Your 30-60-90 Day Quick Start Plan
First 30 Days: Foundation
- Complete risk assessments using the portfolio framework—know your vulnerabilities.
- Establish incident command structure—name commanders and alternates.
- Audit existing supplies—identify gaps against calculated requirements.
- Register with FIRM—enable digital coordination immediately.
Days 31-60: Structure
- Develop property-specific protocols using incident matrices—no generic plans.
- Launch staff training on life safety and communication—competence before complexity
- Implement resident notification systems—test every channel.
- Execute vendor agreements—lock in pricing and priority.
Days 61-90: Validation
- Conduct coordinated evacuation drill—learn through action.
- Complete compliance documentation—protect against liability.
- Launch resident education—build community resilience.
- Establish KPI dashboard—prove value from day one.
Resource Requirements and Budget Planning
Implementation requires dedicated management: 0.25 FTE for portfolios under 10 properties, scaling to 1.0 FTE for larger portfolios. Ongoing maintenance needs 0.1 FTE per property—this isn’t a side project.
Technology platforms and supplies require initial investment with ongoing monthly costs. Training investment varies per staff member annually. Total investment: less than one prevented incident, with documented returns of $6 or more per dollar invested according to federal studies⁵.
Transforming Preparedness into Competitive Advantage
Professional disaster preparedness for property management has evolved from insurance requirement to strategic differentiator. The frameworks presented here transform reactive crisis management into proactive risk mitigation. With natural hazard mitigation saving $6 on average for every $1 spent¹, and broader resilience investments potentially returning up to $13 per dollar invested², the business case is clear.
Success requires systematic implementation, not piecemeal improvements. Begin with risk assessment to establish baselines. Build scalable incident command structures. Invest in platforms that enable coordination. Recognize that preparedness isn’t a project but a program requiring sustained commitment and continuous improvement.
Your path forward is clear. Schedule a demonstration of FIRM’s incident management platform to see how digital coordination revolutionizes emergency response. Contact us to learn how leading property managers achieve preparedness advantage. Your residents trust you with their homes and lives. Your stakeholders trust you with their investments. Professional preparedness protects both while transforming regulatory requirement into competitive advantage.
The broken coffee maker in the break room might not get fixed. But when disaster strikes your properties, you’ll be ready. That’s the difference professional preparedness makes.
References
- Federal Emergency Management Agency. “Natural Hazard Mitigation Saves Fact Sheet.” FEMA.gov, June 2018. https://www.fema.gov/sites/default/files/2020-07/fema_mitsaves-factsheet_2018.pdf
- U.S. Chamber of Commerce. “Preparing for disaster saves on damages, economic impact.” USChamber.com, 27 Sept. 2024. https://www.uschamber.com/security/being-prepared-for-the-next-disaster-pays-off-new-study-shows
- National Oceanic and Atmospheric Administration. “2024: An active year of U.S. billion-dollar weather and climate disasters.” NOAA Climate.gov, 10 Jan. 2025. https://www.climate.gov/news-features/blogs/beyond-data/2024-active-year-us-billion-dollar-weather-and-climate-disasters
- California State Assembly. “California Disaster Preparedness – Emergency Information and Resources.” Disaster.asmdc.org, 2024. https://disaster.asmdc.org/
- National Institute of Building Sciences. “Natural Hazard Mitigation Saves: 2017 Interim Report.” NIBS, Jan. 2018. https://www.nibs.org/page/mitigationsaves
Related posts
How to Prevent Mold Growth on Rental Properties
Mold growth prevention and mold removal methods are two of the most frequent ten
Capacity Assessment in Disaster Management: Building Lasting Resilience Through Strategic Evaluation
Capacity assessment in disaster management evaluates whether your organization c

How Recent Changes to RRP Rules Affect Property Management
Renovation, repair, and painting (RRP) rules were created by the EPA to p